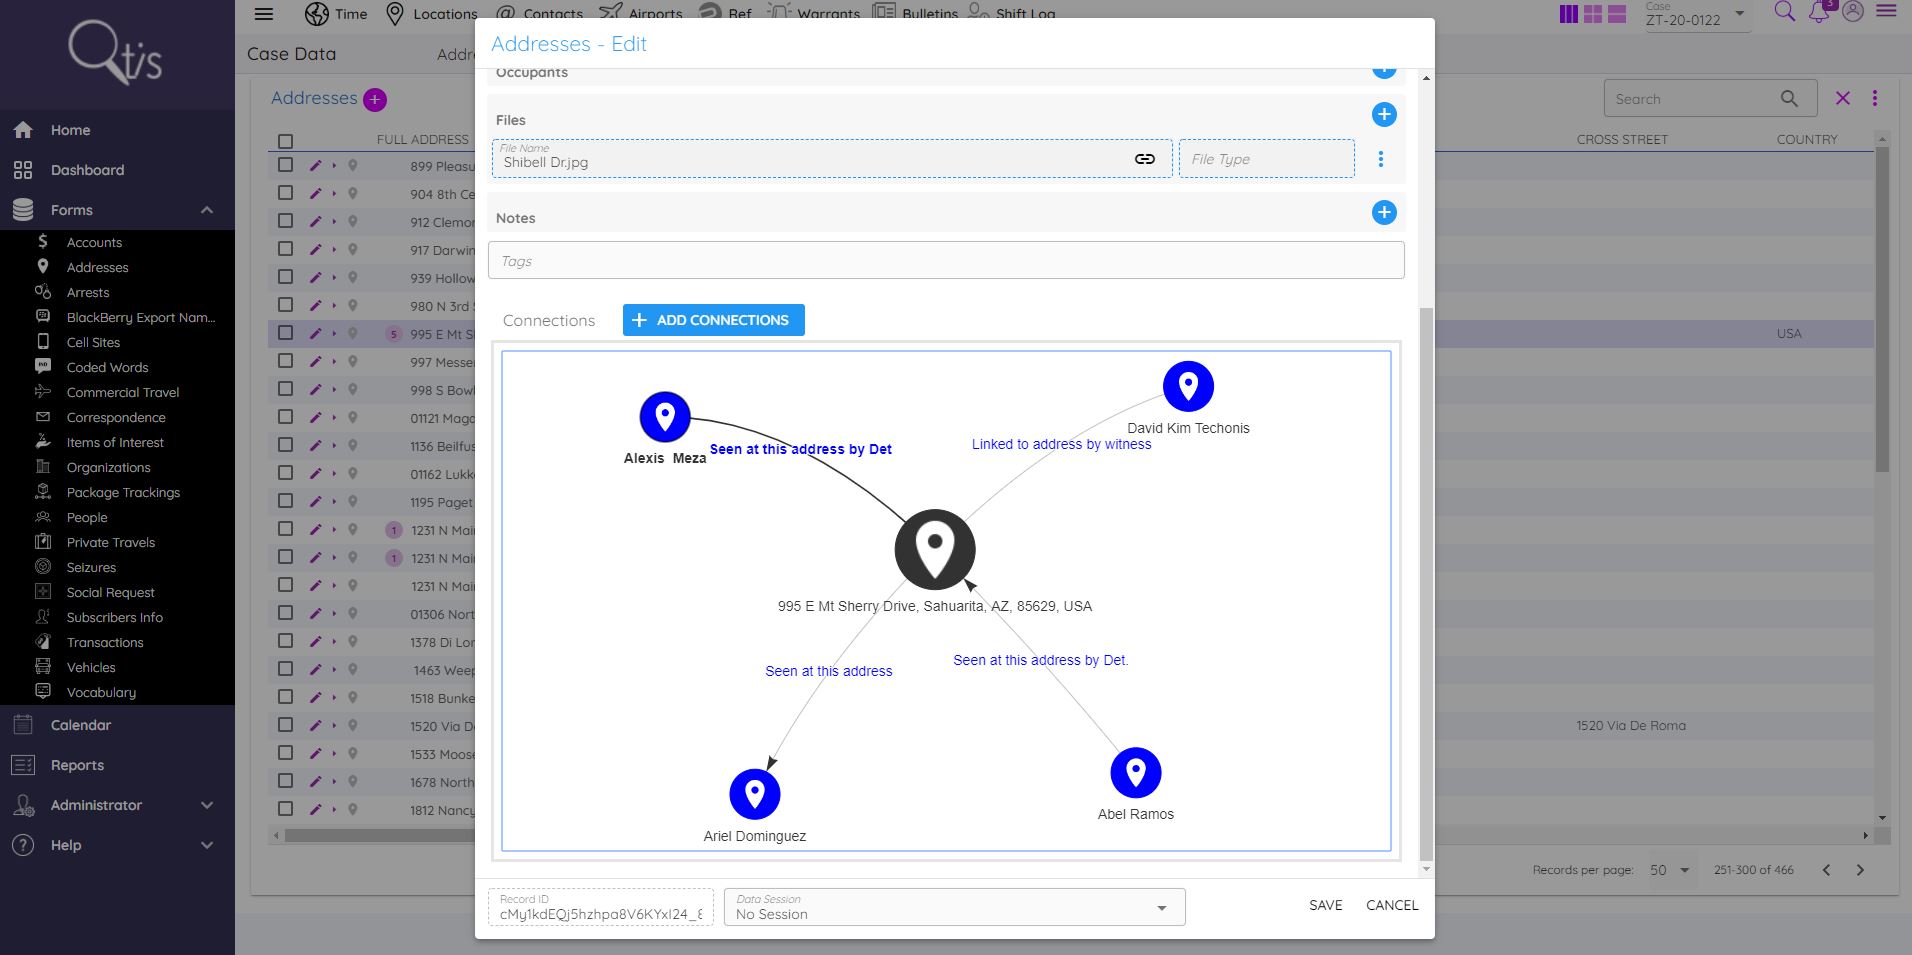
What is data visualization?
Data visualization is a powerful tool that can greatly enhance your business decision-making process. It involves presenting data in a visual format, such as charts, graphs, and maps, to help you understand complex information more easily. By transforming raw data into visually appealing and intuitive visuals, data visualization allows you to identify patterns, trends, and correlations that may not be apparent in raw data alone. This not only helps you make more informed decisions but also enables you to communicate your findings and insights to others more effectively. Whether you are analyzing sales data, customer behavior, or market trends, data visualization can provide you with a clear and concise representation of your data, making it easier to identify opportunities, solve problems, and drive business growth.

The importance of business decision making
Effective business decision making is crucial for the success of any organization. It involves analyzing data, identifying patterns, and making informed choices that can drive growth and profitability. Data visualization plays a key role in this process by presenting complex information in a visually appealing and easily understandable format. By using charts, graphs, and other visual tools, decision makers can quickly grasp trends, outliers, and correlations that may not be apparent in raw data. This enables them to make faster and more accurate decisions, identify opportunities and risks, and communicate their findings to stakeholders. In today’s data-driven world, harnessing the power of data visualization is essential for businesses to stay competitive and make strategic choices that can propel them forward.
How data visualization can benefit business decision making
Data visualization is a powerful tool that can greatly enhance business decision making. By presenting complex data in a visual format, such as charts, graphs, and infographics, it becomes easier to understand patterns, trends, and relationships. This allows decision-makers to quickly grasp key insights and make informed choices. Additionally, data visualization can help to uncover hidden patterns or outliers that may not be apparent in raw data alone. By visually representing data, businesses can communicate information more effectively, ensuring that all stakeholders are on the same page and can contribute to the decision-making process. Ultimately, data visualization can lead to more efficient and effective decision making, resulting in improved business outcomes.
Visualizing data for trend analysis
Visualizing data for trend analysis is a powerful tool that can greatly enhance your business decision making. By representing complex data sets in visual formats such as charts, graphs, and diagrams, you can easily identify patterns, correlations, and trends that may not be immediately apparent from raw data. This visual representation allows you to quickly and intuitively grasp the key insights and make informed decisions based on the data. Additionally, data visualization enables you to communicate your findings effectively to stakeholders, making it easier to gain buy-in and support for your business strategies. Whether you are analyzing sales data, customer behavior, or market trends, harnessing the power of data visualization can give you a competitive edge in today’s data-driven business landscape.
Using data visualization for forecasting
Data visualization is a powerful tool that can greatly enhance the process of forecasting in business decision making. By presenting complex data in a visual format, businesses are able to gain a deeper understanding of trends, patterns, and relationships that may not be immediately apparent in raw data. This enables more accurate predictions and forecasts, leading to better-informed decision making. Additionally, data visualization allows for the identification of outliers and anomalies, providing valuable insights into potential risks or opportunities. With the ability to quickly and easily interpret data through visually appealing charts, graphs, and dashboards, businesses can make more strategic and informed decisions that drive success.
Making data-driven decisions with visualized data
Visualized data can greatly enhance your business decision-making process. When you have large amounts of data to analyze, it can be overwhelming and difficult to extract meaningful insights. However, by visualizing the data through charts, graphs, and other visual representations, you can easily identify patterns, trends, and correlations that may not be apparent in raw data alone. Visualizations also enable you to communicate complex information more effectively to stakeholders, making it easier for them to understand and support your decision-making process. By incorporating data visualization into your business strategy, you can make more informed decisions that are based on solid evidence and increase the likelihood of achieving your desired outcomes.
Enhancing communication and collaboration through data visualization
Data visualization is a powerful tool that can greatly enhance communication and collaboration within your business. By presenting complex data in a visual format, you can effectively convey information and insights to your team members, clients, and stakeholders. Visualizing data not only makes it easier for others to understand and interpret, but it also encourages engagement and promotes meaningful discussions. With the help of data visualization, you can uncover patterns, trends, and relationships that may not be immediately apparent in raw data, enabling you to make more informed and strategic business decisions. Whether it’s through charts, graphs, or interactive dashboards, data visualization empowers you to effectively communicate your ideas, share knowledge, and foster collaboration within your organization.
Tools and techniques for effective data visualization
Data visualization is a powerful tool that can greatly enhance your business decision-making process. By utilizing various tools and techniques, you can transform complex data sets into clear and visually appealing representations. One such technique is the use of interactive charts and graphs, which allow you to explore and analyze data in a more dynamic and intuitive way. Additionally, incorporating color and design principles can help to highlight key insights and patterns within your data. By harnessing the power of data visualization, you can make more informed decisions, identify trends, and communicate your findings effectively to stakeholders.
Best practices for implementing data visualization in business decision making
Implementing data visualization in business decision making can greatly enhance the effectiveness and efficiency of the decision-making process. By presenting complex data in a visual format, such as charts, graphs, and infographics, decision-makers can quickly and easily identify trends, patterns, and outliers. This not only helps in understanding the data more comprehensively, but also enables the identification of key insights and opportunities that may have otherwise been overlooked. Furthermore, data visualization promotes better communication and collaboration among team members, as visual representations make it easier to convey information and share findings. By following best practices, such as choosing the right type of visualization and ensuring data accuracy, businesses can leverage the power of data visualization to make informed and impactful decisions that drive success.
Conclusion: The power of data visualization in driving business success
Data visualization is a powerful tool that can greatly enhance business decision making and drive overall success. By presenting complex data in a visual format, such as charts, graphs, and interactive dashboards, businesses gain a clearer understanding of trends, patterns, and insights. This enables decision-makers to make more informed and strategic choices, leading to improved efficiency, cost savings, and increased profitability. Data visualization also allows for effective communication and collaboration among teams, as it simplifies complex information and facilitates a shared understanding. By harnessing the power of data visualization, businesses can unlock valuable insights and gain a competitive edge in today’s data-driven world.


 520 838 0346
 sales@zinatt.com


